
Local evidence.
Development context.
Each authority brings its own planning context. Dataset scope and development classifications provide the foundation for useful comparisons.
Planning evidence · Refusal Limited
Refusal Atlas
The value is in the dataset. Refusal Atlas connects planning refusal reasons, development types and policy references, so individual decisions become a broader picture you can investigate.
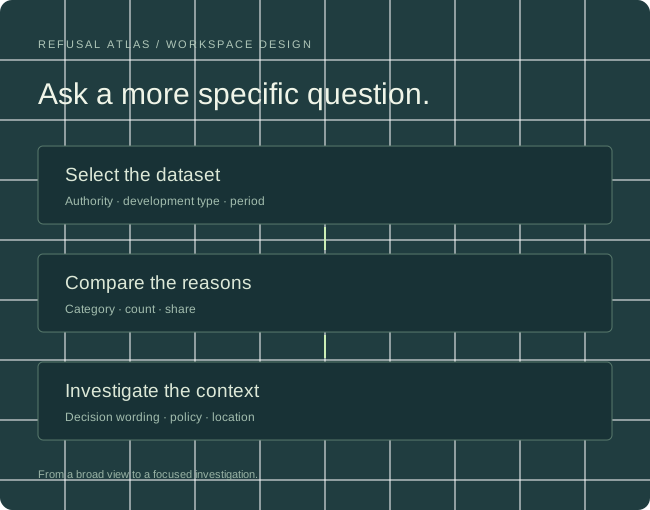
A growing evidence base
A single refusal explains one proposal. A collection of reasons reveals which issues recur, how they differ by development type, and where closer investigation is worthwhile.
The collection connects local planning decisions with their development context, covering different types of residential proposals and the refusal themes that recur within them.
The research uses detailed, study-specific classifications to preserve the substance of refusal reasons, rather than reduce every decision to a generic score.
Interface preview
Select a development type and compare two authorities. Switch between counts and shares to explore the interface.
Compare category counts within the selected scope. Category shares are different from overall application refusal rates.
Select a numbered marker to inspect a case. Filter by refusal theme to focus the map.
Interpret policy references in the date-specific context of each planning decision.
These official resources may display newer versions. Use the edition relevant to the decision date when investigating a policy reference.
Dataset depth × geographical breadth
Each authority adds more than a point on a map. It adds decisions, local policy context and another basis for comparison.
Each authority brings its own planning context. Dataset scope and development classifications provide the foundation for useful comparisons.
The interface design uses searchable authority selection, regional groups and coverage summaries. Users narrow the collection by geography, decision period, development type and evidence availability before comparing results.
Residential studies anchor the collection. The coverage model accommodates commercial and industrial segments, each with relevant categories and a visible sample base. Residential findings stay within their original scope.
Retain original refusal wording and study-specific categories, then map them to shared themes for wider comparisons. Keep the mapping version, dates and denominators with each result. New area releases extend the evidence base and give returning users more locations and development contexts to investigate.
Cloud architecture / working design
The architecture separates evidence preservation, AI classification and user-selected statistics. Cloud resources scale with document volume, collection breadth and analytical demand.
Object storage holds documents and extracted text. A source manifest records the authority, application reference, decision date, document location and retrieval history.
Processing jobs extract reasons and policy references, retain source passages and assign detailed categories. Versioned classifications support both study-specific analysis and cross-authority themes.
A geospatial database and analytical tables support borough, date, development and reason filters. The query layer returns counts, statistical bases and coverage with the result.
Store once, investigate in many ways. The same structured collection underpins the comparative dashboard, location workspace, policy navigation and institutional AI-agent access through MCP.
For evidence-led development decisions
For investors, developers, planners, architects, building surveyors and owners’ development representatives. Also for NGOs and built environment students exploring how planning policy is applied.
Recurring membership centres on access to the analysed planning application pool, with tiers organised by development scale. The product connects statistical exploration with the context behind each result.
Development is led by a computer scientist, with input from surveyors and a legal professional specialising in construction projects. We plan to seek venture funding and scale the evidence collection and analytical capacity with a cloud provider.
Explore the evidence
Tell us the authorities, development types and refusal themes relevant to your work.